Need RV repairs? Be prepared to wait!

RECT is an acronym for Repair Event Cycle Time—the time from the start date of an RV repair order to its completion. Note that RECTs that took longer than two years (!) are not included.

Last summer I reported on a possible silver lining to the grey cloud of plunging RV sales: the decline in high-margin sales meant dealers had more incentive to beef up their servicing efforts. Complaints about months-long waits to get even basic repairs had been exploding, thanks in part to shoddy workmanship and substandard parts as manufacturers rushed product out the door—then dragged their heels on approving warranty repairs. Add a resulting shortage of replacement parts, and the completely predictable result was an average wait time last May of 34 days for non-warranty work—but 50 days for warranty repairs.

And if even one part was out of stock? That national average jumped to 73 days for non-warranty work, 89 days for warranty repairs.

Crazy, right? But that was actually an improvement over December 2022, when the national repair time had averaged 53 days, and the wait time for both warranty and out-of-stock repairs had nudged down a bit. Not a huge change overall, true, but moving in the right direction and with every reasonable expectation that the improvement would continue.

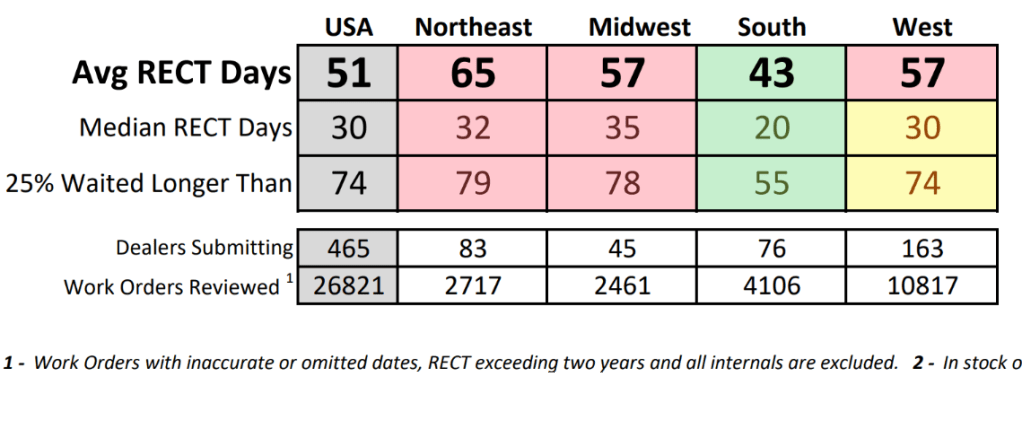
But that was then, and this is now. The average national repair time this past December shot back up, to 51 days—and if you’re unlucky enough to be in the northeast, that average was 65 days. In May, 25% of all customers had to wait longer than 33 days for their repairs to be completed; in December, that wait time for the unlucky 25% had more than doubled, to 74 days. The national average wait of 50 days for warranty repairs in May had jumped to 67 days in December, and to a whopping 90 days in the northeast. Meanwhile, the percentage of repairs that languished because parts were out of stock jumped to 33% in December from 21% in May, extending those repairs by another week.

It wasn’t supposed to be like this. The number of RVs cranked out by manufacturers last year was roughly half that of 2022, which one might think would mean more time for quality control on production lines. Lower production and the repair of pandemic-disrupted supply lines should have replenished parts stocks, not squeezed them further. And after several years of pumping money into its technical institute, the RV Industry Association was boasting in December of having the largest number of certified techs in the RV industry’s history.

So where’s the bottleneck?

A good question, and one the industry hasn’t yet acknowledged, much less answered. To be sure, some of the numbers above may be attributable to seasonal variations, if inexplicably so: repair times seem to peak in December and January, then gradually decline through the spring and summer before bottoming out around October. Still, the latest peaks are significantly higher than those of a year ago, so progress this ain’t. The only thing certain is that RV owners who need repairs are still twisting in the wind, their expensive and frequently highly leveraged adult toys sitting on a dealer’s lot somewhere for months on end.


The data above, utilized by the RV Dealers Association for the benefit of its members, is extracted from much more extensive research conducted by a systems software company called Integrated Dealer Systems. Number nerds who would like to explore that information more thoroughly can go deeper here. 

Do soft sales mean quicker repairs?

As shipments of new RVs stagnate at a hair above 30,000 a month, posting a near 50% decline year-to-date over 2022, the dealers who sell those RVs likewise are getting a severe haircut. May sales revenue dove 26% from May of last year and was down 28% compared with May of 2021, according to a recent report from the RV Dealer Association (RVDA). But here’s a bright note amid the gloom: all that loss of sales business may mean it’s taking less time to get your RV repaired.

That suggestion—and thus far, that’s all it is—can be teased out of the report’s RV Repair Event Cycle Time (RECT), which the association defines as the time between the start date of a work order and its completion. After reviewing 41,538 work orders around the country, the RVDA concluded that the average RECT in May was 34 days. The good news: that’s down significantly from a 53-day peak in December, and an improvement over the 40 days recorded last May, attributable perhaps to dealers having more incentive to focus on repairs as more profitable RV sales withered.

The bad news? An average score can hide a whole mess of ups and downs.

Just how much variation can be concealed within an average is suggested by another statistical measure in the RVDA report, the median. While the average RECT was computed by adding up all the days it took to complete 41,538 repairs and dividing that total by 41,538, the median establishes the midpoint at which half of all repairs lasted longer and half less. And as the RVDA reported, the median RECT in May was just 11 days.

How can the median be so much less—just one-third—than the average? Because the repairs that took longer than 11 days took a lot longer, as many RV owners already know. Indeed, 25% of all repair customers in May had waited more than 33 days for the job to be done. And while RVDA’s report did not add any additional data points on the long end of the scale, it did note that it had excluded any RECTs exceeding two years. (!) Meanwhile, it’s also worth noting that the median got shifted toward the short end of the time scale because 25% of all customers waited less than three days for the job to be done, presumably because those repairs were relatively minor.

That’s the big picture. The reality, however, becomes more stark when a couple of variables get pulled out of the data: whether repair work is done under warranty, and whether the job requires parts that are not in stock. If the repair was under warranty (42% of the total), the average RECT jumped from 34 days to 50 (RVDA did not break out medians), and if one or more parts are not in stock (24% of the time), the RECT soared to 73 days. Have a warranty repair that also required ordering parts? You looked at an average of 89 days in the shop. Conversely, a non-warranty repair with in-stock parts got you out in 15 days.

Those are national averages, but RVDA also broke out regional numbers, dividing the country into West (11 states), South(16 states), Midwest (12 states) and Northeast (nine states) regions. While the overall RECT averages hardly varied from one to another, the southern states had a clear advantage on both warranty work (a RECT of 46) and when needing to order parts (a RECT of 66). The Midwest fared worst on warranty work (a RECT of 56) and almost worst on the out-of-stock measure (a RECT of 79, just slightly behind the Northeast’s leading 81), which is ironic, considering that Indiana is ground-zero for RV production.

There’s even more variation within those numbers, as warranty RECTs can vary considerably not only within a region but by brand. So, for example, Jayco Eagles had a 108-day RECT in the Northeast states, significantly longer than the next lengthiest RECT by brand, Grand Design’s Solitude in the Midwest, at 99 days. One shouldn’t read too much into those findings, because all that slicing and dicing results in increasingly shaky statistical certainty. The Jayco Eagle, for example, was the tenth most frequently repaired RV under warranty in the Northeast in May, out of a total of 2,612 warranty jobs altogether and an unspecified total number of brands. On the other hand, those statistics indicate just how bad things can get. . . .

In addition to its eye-opening repair statistics, the RVDA report also included purchase figures that underscore the magnitude of the investment RV buyers are making—and therefore why they may get furious when that investment ends up sitting in a repair bay for two, three or more months. The average selling price of an RV in May was $51,896, the association reported, with an average down payment of $8,957 and an average of $50,844 financed over 16 years at an APR of 9.61%. The resulting average monthly payment of $517 means that RV will end up costing $99,264 in monthly installments, or more than $108,000 when adding in the down payment—and more than double the alleged “selling” price.

No one can claim a rapidly depreciating RV makes sense as an investment—but if it’s not that, it should at least be usable.

Most recent posts